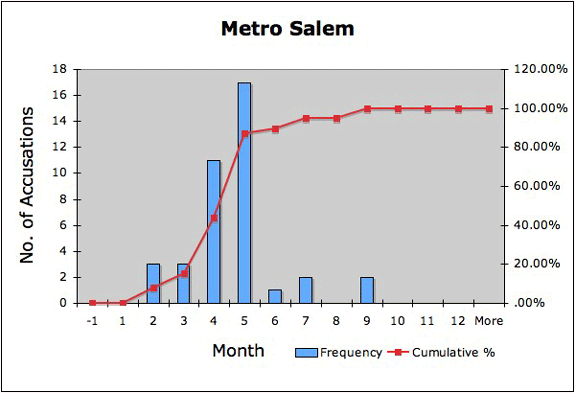
Metro Salem
| Bin | Frequency | Cumulative % |
| -1 | 0 | .00% |
| 1 | 0 | .00% |
| 2 | 3 | 7.69% |
| 3 | 3 | 15.38% |
| 4 | 11 | 43.59% |
| 5 | 17 | 87.18% |
| 6 | 1 | 89.74% |
| 7 | 2 | 94.87% |
| 8 | 0 | 94.87% |
| 9 | 2 | 100.00% |
| 10 | 0 | 100.00% |
To display accusations in all of Salem, construct a cumulative histogram, open a new worksheet and create a "Metro Salem" column and a "Bin" column. Combine the data of both the "Salem Village," and Salem Town" columns and paste into the "Metro Salem" column of the new worksheet. Copy the "Bin" data into the adjoining "Bin" column. Use "Metro Salem" for the "Input range," and "Bin" column for the "Bin range." (Select "Labels," "Cumulative percentage," and "Chart output.")

The cumulative chart (top) and histogram (above) show that by the end of June 1692, 90% of of the thirty-nine accusations in both Salem Town and Village had taken place. The destructive energy of the witch hunt occurred during the first wave of accusations. It was intense but relatively short lived. Few Salem residents proved to be at risk during the second wave of accusations after June.
To return to the Salem Town Accusations page, click Back or Next.